Unity Monitor OS
A custom Raspberry Pi OS for Unity Monitor.
Overview
Get started monitoring quickly with our custom Raspberry Pi OS image. Unity Monitor OS contains everything needed to run the monitoring system locally on your Pi.
Our OS is built from a stock Raspberry Pi OS Lite image – all you’ll have to do is flash it to your microSD card. Plus, it’s lightweight enough to run on less capable Raspberry Pi’s like the Pi 2B and new Pi Zero 2.
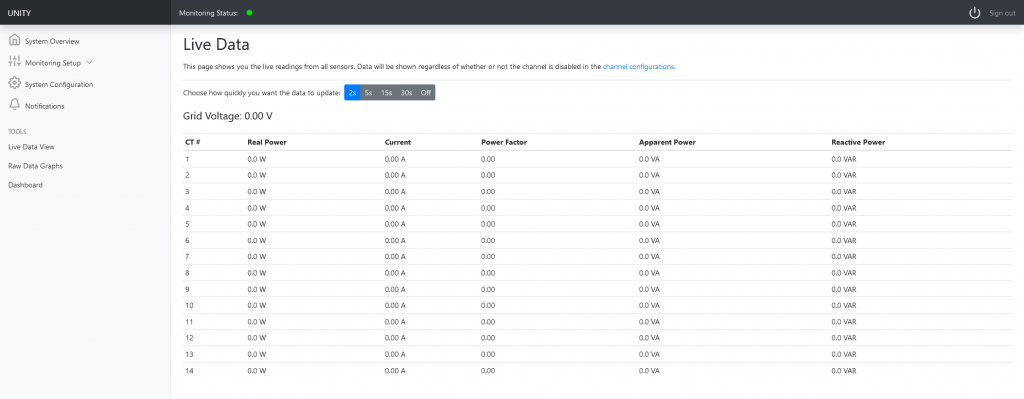
The OS is used for setup, management, and configuration of the Unity Monitoring system. Once your Pi is networked (via Wi-Fi or Ethernet cable LAN), you can access the admin panel from any other computer on your network.
Note: Internet access is not required, but local area network (LAN) access is. Unity Monitor relies only on having a local area network connection so that you can reach the administrative dashboard from a desktop, laptop, tablet, or cell phone on the same network.
No programming or command line knowledge is necessary. All changes are made through the web user interface.
Features
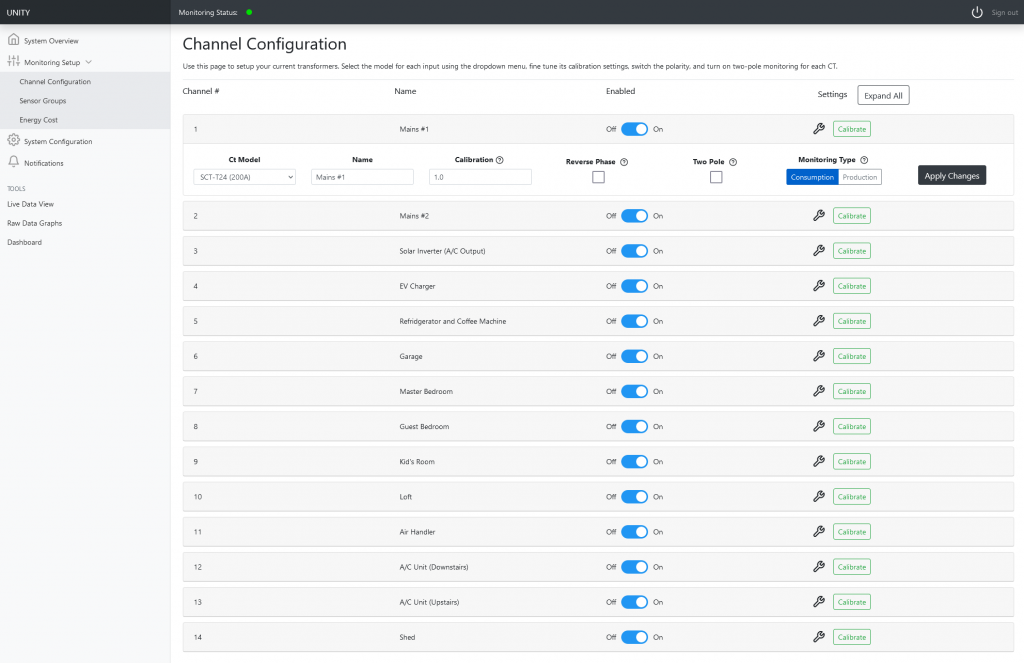
- Easy channel configuration. Simply select which sensor you have and give it a name!
- Time of use cost tracking. Set up different time intervals for your various time-of-use billing arrangements to keep track of costs during peak hours.
- Private & self-contained. No data leaves your Raspberry Pi.
- Monitoring cluster. (Coming soon!) Need more than 14 sensors? Combine multiple Unity Monitor systems into one, holistic view.
- Sensor groups. Combine individual sensors together for a summed reading
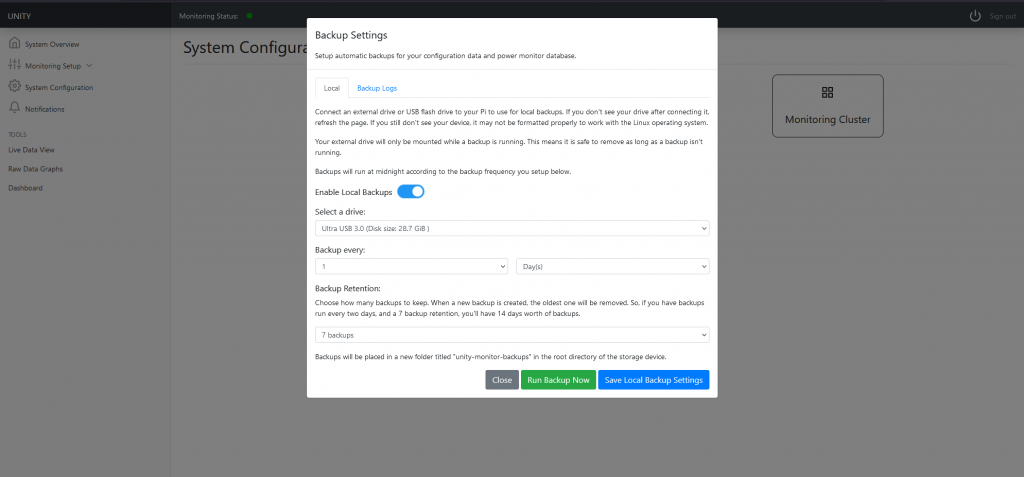
- Automatic USB backups. Plug in a USB flash drive and go through the simple USB backup setup.
- Raw data view. Generate a snapshot in time and view a plot of the the raw sensor data for specific (or all) channels at once.
- Remote InfluxDB support. Already have an InfluxDB server running elsewhere? Simply provide the IP address and credentials (if applicable) and Unity Monitor will send its measurements there.
- Highly customizable dashboard. Grafana provides an easy to use interface for displaying your data exactly how you want to see it.
- Automatic data down-sampling. Data is automatically down sampled over time, saving you disk space, and allowing you to look at weeks, months, and even years of data at a time.
- One click upgrades. (Coming soon!)


